Insight
Published and updated
Infrastructure Update: The 2017 ASCE Report Card
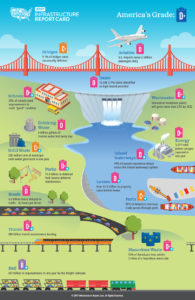
In 2013, the American Society of Civil Engineers (ASCE) Report Card for America’s Infrastructure handed down an overall grade of D+. The recent update to that report card drops the overall grade to D-. What happened? Can the current administration’s verbal commitment to investing $1 trillion in infrastructure improve our GPA in 2021?
In last year’s 3-part series, we examined many of the infrastructure categories that appear on the ASCE report card:
- America’s Crumbling Infrastructure Part 1: Transportation
- America’s Crumbling Critical Infrastructure Part 2
- Crumbling Infrastructure 3: Schools, Nukes, Food and Garbage
Much of the data cited in those articles came from the 2013 ASCE report card. With the release of the 2017 version, I wanted to take another look to see what’s changed (or hasn’t changed) and why.
What’s Happened Since 2013?
For these updates, I dug into the ASCE’s new report cards, which are linked below with their respective category. I highly recommend checking out the full report cards as they are fascinating, particularly from a cause-and-effect perspective. Generally, the slow slog of infrastructure and bureaucracy can’t keep up with population growth and technology.
| Category | 2017 ASCE Grade | 2013 ASCE Grade |
|---|---|---|
| Aviation | D | D |
| Roads | D | D |
| Ports | C | C+ |
| Inland waterways | D- | D |
| Mass transit | D | D- |
| Passenger rail | C+ | B |
| Energy | D+ | D+ |
| Drinking water | D | D |
| Wastewater | D | D+ |
| Public schools | D | D+ |
| Solid waste | B- | C+ |
Aviation (D to D): Why no change? The two biggest issues seem to be increased traffic and a lack of funding to keep up with that traffic. There were 728 million more enplanements in 2015 than in 2011. Repeated failures by Congress to regularly reauthorize programs leads to “delays in investment decisions of FAA-funded airport projects.”
Roads (D to D): Why no change? Underfunding. ASCE cites a $836 billion backlog of highway and bridge capital needs. Much of the federal funding for road infrastructure comes from fuel taxes, which have remained at 18.4 cents per gallon since 1993.
Mass Transit (D to D-): Why the downgrade? Our buses and trains have improved, but the tracks, roads and stations have not. Infrastructure repairs are more expensive and are continually deferred, which has created a massive backlog that cannot be completed within current funding models.
Passenger Rail (C+ to B): Why the improvement? Better funding over the past five years. Amtrak covers most of its operating costs with ticket sales. It received a $2.45 billion loan from the U.S. Department of Transportation in 2016 to improve trains, tracks and stations.
Energy (D+ to D+): Why no change? New funding has been invested into sustainable energy and long-term capacity. Unfortunately, the power lines and pipelines themselves are already outdated and deteriorating rapidly.
Drinking Water (D to D): Why no change? Water consumption is down by 5% this decade, according to the ASCE. Nevertheless, the old rusty pipes that deliver the water are leaking about two trillion gallons per year.
Wastewater (D to D+): Why the improvement? We’re turning more waste into energy. Also, years of treatment plant upgrades are paying off, and more stringent regulations have reduced untreated releases.
Public Schools (D to D+): Why the improvement? From 2011 to 2013, school districts invested up to $49 billion per year for new facilities and capital construction. Unfortunately, multiple siloed stakeholders and uncertain budgets continue to prevent comprehensive insight into public school infrastructure.
Solid Waste (B- to C+): Why the downgrade? We’re generating more municipal solid waste (MSW). In 2014, we had 258 million tons. Heavy involvement from the private sector keeps this category relatively high graded, but more funding is needed to help us rethink how we generate waste.
Math Problem
Given, I am a product of our D+ public school system. Nevertheless, even I can see how these numbers don’t add up. Here’s Greg DiLoreto, past president of American Society of Civil Engineers (ASCE) and chair of the Committee on America’s Infrastructure, in an interview with Treatment Plant Operator magazine: “Between now and 2025 we show total needs of $4.6 trillion, but based on current funding streams, we are investing $2.5 trillion. So overall, we’re looking at a shortfall of $2.1 trillion.”
“Shortfall” is a nice way of putting it. Even if the current administration stands by its trillion dollar commitment, we will still be a trillion dollars away. And the infrastructure scope continues to expand, namely, an additional $2.6 billion earmarked for “high-priority border security technology” in 2018 alone.
Maybe the flying car will swoop in to save us?
